Career · BI Enablement · Fabric
Sales SSBI — Project Architecture
Episode 1 · Excel + Azure SQL → Microsoft Fabric Lakehouse → Power BI semantic model. Dual sources → medallion lakehouse → Direct Lake semantic model → report. Local pandas mirrors Fabric so Phase 12 numbers stay identical.
docs/runbooks/Sales_SSBI_Execution_Runbook.docx.
Local parity —
python pipeline/medallion_pipeline.py.
1. Data architecture (medallion)
Excel and Azure SQL are interchangeable after Bronze reconciliation (10,593 = 10,593). Azure SQL is provisioned in Azure Portal, loaded locally, then copied into the Lakehouse via a Fabric Azure SQL connection.
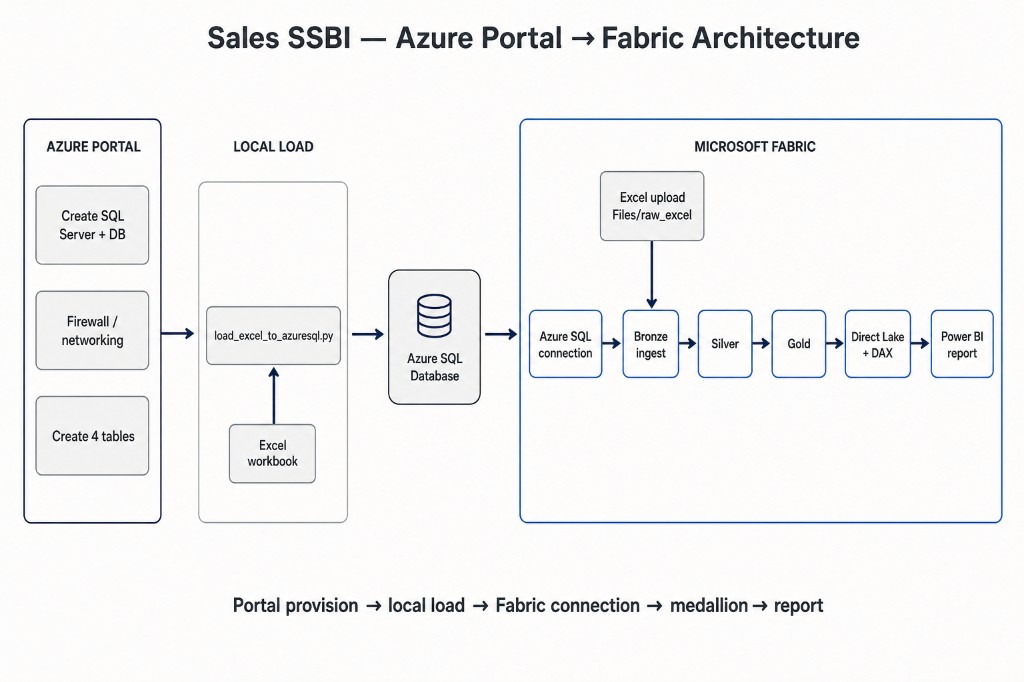
flowchart LR
  subgraph Azure["Azure Portal"]
    AP[Create SQL Server + DB]
    NET[Networking / firewall]
    TBL[Create 4 tables]
    AP --> NET --> TBL
  end

  subgraph Load["Local load"]
    XLS[Excel workbook]
    LDR["load_excel_to_azuresql.py"]
    XLS --> LDR
  end

  subgraph Sources
    X[Excel to Files/raw_excel]
    S[Azure SQL Database]
  end

  subgraph Fabric["Microsoft Fabric"]
    CONN[Azure SQL connection]
    B[Bronze ingest + reconcile]
    V[Silver conform]
    G[Gold aggregate]
    M[Direct Lake + DAX]
    R[Power BI report]
    CONN --> B
    B --> V --> G
    V --> M
    G --> M
    M --> R
  end

  TBL --> S
  LDR --> S
  X --> B
  S --> CONN
Azure Portal → Fabric path
flowchart TB
  A1[Azure Portal: SQL Server + Database] --> A2[Firewall: client IP + Allow Azure services]
  A2 --> A3[Query editor: create Transactions / DimStore / DimProduct / DimTarget]
  A3 --> A4["Local: load_excel_to_azuresql.py"]
  A4 --> A5[Fabric: create Azure SQL cloud connection]
  A5 --> A6["Bronze_Ingest_Pipeline: Copy_AzureSQL + ForEach dims"]
  A6 --> A7[Files/bronze]
  A7 --> A8[Silver → Gold → semantic model → report]
  E1[Upload Excel to Files/raw_excel] --> E2[Copy_Excel_Transactions]
  E2 --> A7
| Step | Where | What |
|---|---|---|
| 1. Provision | Azure Portal | Create SQL Server + database |
| 2. Network | Azure Portal → Networking | Allow client IP + Azure services (for Fabric copy) |
| 3. Schema | Azure Portal Query editor | Create Transactions, DimStore, DimProduct, DimTarget |
| 4. Load | Local | load_excel_to_azuresql.py (ODBC 18; no committed passwords) |
| 5. Connect | Fabric | Cloud connection to Azure SQL |
| 6. Ingest | Fabric pipeline | Copy_AzureSQL_Transactions + dim loop → Bronze |
| 7. Downstream | Fabric | Silver → Gold → Direct Lake → report |
2. Layer contracts
Fabric: Bronze_Ingest_Pipeline → Files/bronze/
Local: Excel + SQLite; assert row equality
Fabric: Silver_Conform → Delta silver_fact_sales
Local: De-dupe, join dims, write parquet
Fabric: Gold_Aggregate → gold_by_* + dim_target
Local: Groupbys → data/output + actual_facts.json
Fabric: Direct Lake default model + browser report
Local: Validate against actual_facts.json
3. Development flow
flowchart LR
  P[1. Plan] --> L[2. Local reference]
  L --> F[3. Fabric build]
  F --> M[4. Semantic model]
  M --> S[5. Validate and ship]
Plan
- Define grain
- Additive vs rate measures
- Direct Lake constraints
Local reference
- medallion_pipeline.py
- Excel ≡ Azure SQL
- Write Gold outputs
Fabric build
- Runbook Phases 1–12
- Pipeline + notebooks
- Default semantic model
Semantic model
- Correct relationship grain
- Paste 10 DAX measures
- No calculated cols on DL
Validate & ship
- Match actual_facts.json
- Report + screenshots
- Content pack
4. Dual-track: Local ↔ Fabric
flowchart TB
  subgraph Local["Local track — fast feedback"]
    LP["pipeline/medallion_pipeline.py"]
    LS["data/sources/"]
    LO["data/output/ Gold CSVs + actual_facts.json"]
    LP --> LS
    LP --> LO
  end

  subgraph Fabric["Fabric track — production path"]
    WS[Workspace + Lakehouse]
    PIP[Bronze_Ingest_Pipeline]
    NB[Silver_Conform + Gold_Aggregate]
    SM[Default semantic model Direct Lake]
    RP[Browser report]
    WS --> PIP --> NB --> SM --> RP
  end

  LO -.->|same Phase 12 numbers| SM
pipeline/medallion_pipeline.py — pandas Bronze / Silver / Gold against data/sources/.
load_excel_to_azuresql.py loads Excel into the Azure Portal–provisioned SQL DB (never commit passwords).
Notebooks document Spark logic recreated in Fabric.
Portal: SQL Server + DB → firewall → 4 tables → local load.
Fabric: Azure SQL cloud connection → Bronze copy activities → Lakehouse Files/bronze.
Then Silver → Gold → Direct Lake → report. Missing Date relation makes YoY % silently 0.
5. Fabric runbook phases
| Phase | Name | Track | Primary artifact |
|---|---|---|---|
| 1–2 | Workspace + Lakehouse | Fabric | Sales-SSBI-Project · Sales_SSBI_Lakehouse |
| 3–4 | Source landing | Azure + Fabric | Portal SQL Server/DB/tables · Excel → Files/raw_excel · Fabric Azure SQL connection |
| 5 | Bronze ingest | Fabric | Bronze_Ingest_Pipeline (Copy + ForEach dims) |
| 6–7 | Silver conform | Both | Silver_Conform → silver_fact_sales (+ RegionMonthKey) |
| 8–9 | Gold aggregate | Both | Gold_Aggregate → gold_* + dim_target |
| 10 | DAX measures | Fabric | 10 measures from docs/dax_measures.md |
| 11 | Relationships | Fabric | RegionMonthKey · Date → DimDate |
| 12 | Validate + report | Both | Phase 12 checkpoints · report pages |
6. Semantic model shape
Fact: silver_fact_sales (1 row / transaction line)
Dims: DimDate · dim_target via RegionMonthKey
Additive: Revenue, Total Units, Total COGS, Transactions
Rates via DIVIDE(): AOV, GM %, YoY %, Target Accuracy %
7. Repo map
| Path | Role in the flow |
|---|---|
data/sources/ | Dual inputs: Excel + Azure SQL sim DB |
pipeline/ | Local medallion + Azure SQL loader + Fabric notebook mirrors |
data/output/ | Local Gold CSVs + silver parquet + actual_facts.json |
docs/runbooks/ | Canonical Fabric Phases 1–12 |
docs/dax_measures.md | Phase 10 measure library |
content/ | Report .pbix, YouTube plan/transcript, posts |
assets/screenshots/ | Lakehouse / pipeline / report evidence |
Quick start
pip install -r requirements.txt
python pipeline/medallion_pipeline.py
Fabric: open Execution Runbook → Phases 1–12 in the browser (no Desktop required for Direct Lake default model).